The Event Dashboard is the cockpit of the event statistics. It provides real time information about the number of orders placed and total revenue for the event:
Event Statistics
In addition to the standard event dates, show dates and managers defined in the event, this section provides gross and net square footage statistics. These fields will only show on the Dashboard if they have been populated in the Event Detail form. If they have been filled in, they will appear immediately beneath the Venue field. The gross and net square footage figures will appear, as well as a percentage of the net to gross.
Revenue Statistics
| Field | Definition |
|---|---|
| Charged Revenue | Displayed by customer type and then a total, the charged revenue includes all revenue included in orders with statuses of Confirmed, Payment Pending and Closed that has actually been charged to the customer (Cancelled orders are not included in this revenue). |
| Estimated Revenue | Displayed by customer type and then a total, estimated revenue sums the products that are flagged as estimated products in orders. This represents a "forecast" of what you will additionally charge between now and the end of the event. You may or may not have products that use this estimated functionality, and this amount will always be $0.00 if you do not. |
| Total Revenue | Adds Charged Revenue and Estimated Revenue (definitions above) together. |
| Total Exhibitors | Total number of Exhibitors in the event. |
| # With Orders | Total number and percentage of all exhibitors who have placed at least one order. |
| # Without Orders | The number and percentage of exhibitors who have not yet placed an order. |
| Total # of Orders | Total number of orders that have been placed (keep in mind a single exhibitor may have multiple orders). |
| Average Order Size | Total Event Revenue/Total # of Orders. |
| Processed Payments | Total payments that have been processed across all Orders in the event. |
| Balances Due | Revenue not yet collected. |
| Refunds Due | Money due back to customers |
Exhibitor Revenue Pace and Source
This section is an analytical view of how productive your storefront is as well as when it is most productive. This section includes only the exhibitor portion of the revenue for the event. Orders entered into the Admin area are listed in the "Admin" column, and any orders placed through the storefront are in the "Storefront" column. The revenue is shown by order period (advance vs. standard) as well as a total.
Department Summary
Provides order statistics for all departments for the event. Toggle to view the revenue by customer type or as a total. Note that a single order might might contain products that involve multiple departments, so the total number of orders in this section may count a single order more than once. For instance, if Order # 1000 has food and beverage, audio visual and cleaning, that order is a single order but its count will be listed in each of those departments respectively in this section.
Order Summary
This grid provides a grand total of all orders grouped by status (available statuses include Confirmed, Payment Pending and Closed). Toggle to view the revenue by customer type or as a total. Cancelled orders are listed separately and are not included in the grand total. Click on the plus sign next to the order status to view each order comprising the summary for that status. Drill into each order number by clicking on the hyperlinked Order #.
Customer Type Summary
For each department, this section lists the total revenue by customer type.
Other Revenue
This section lists any revenue defined as "gratuity" or "service charge" in your system.
Taxes
Each tax type for the event is itemized.
Shipment Summary
If you are a general service contractor or use shipments, you will see each shipment type listed as well as the total weight and piece count. Estimated products are not included in these figures; these are pulled from only shipments.
Compare Similar Events
You can compare the revenue of similar events (such as the same event year over year) with each other in order to understand whether revenues have increased or decreased. This section explains how to set up the events you want to compare and then how to compare them.
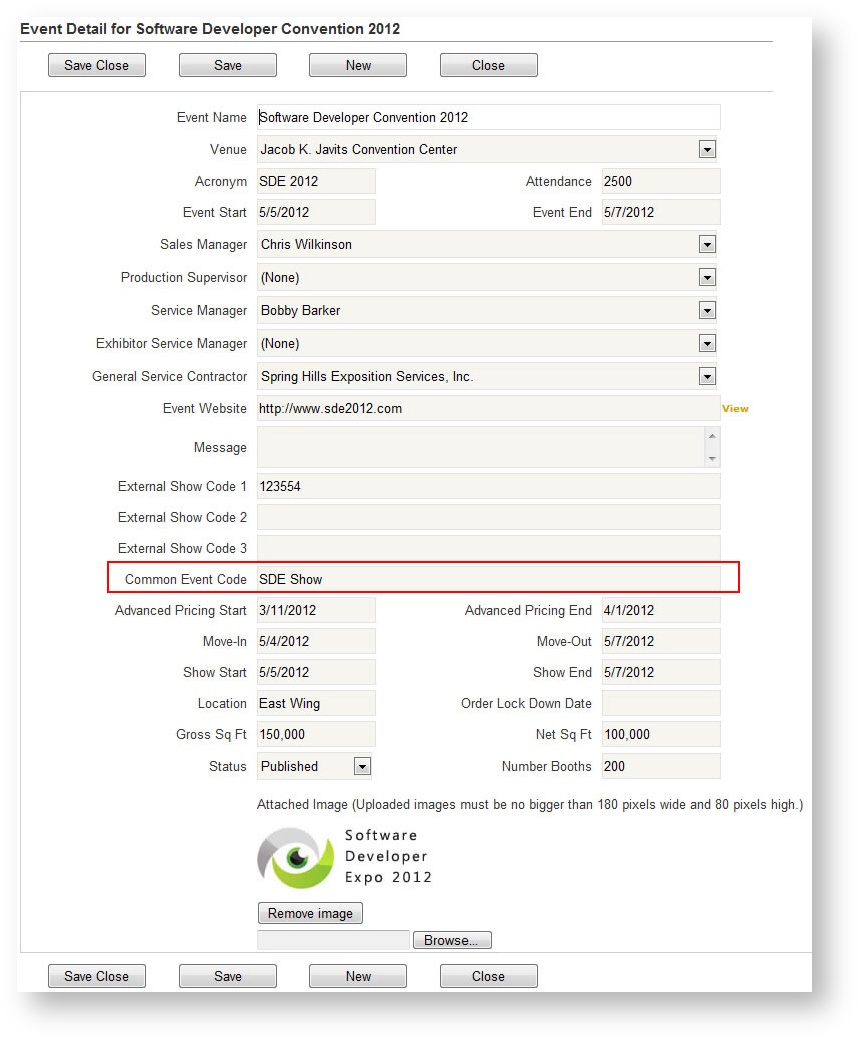
Identifying Similar Events
Before you can compare events, you must mark them all with a common phrase. This can be a show acronym or word (for instance, for the Software Developers Convention 2011 and Software Developers Convention 2012, you might want to be "SDE" or "Software" in both events. It doesn't matter what the phrase is, as long as it is the same in all the events you want to compare exactly. To enter the phrase into the event, simply open up the Event Detail form and put the phrase into the Common Event Code field:
After marking the similar events with the same phrase, simply click the "Compare Similar Events" button at the top of the dashboard. The event you're in will be the event against which the other events will be compared. The report breaks down revenue by customer type. Where the revenue in your current event exceeds the revenue in the event(s) being compared, the font color is green. Where it is less, the font color is red.
Here is an example of the Compare Similar Events report: